
6 Website Performance Metrics To Monitor in HubSpot
Imagine that you're walking through a grassy field. Suddenly, you hear hooves behind you. It's probably horses, right? But what if it’s not horses? What if wild zebras are escaping from a local zoo, and heading in your direction? It’s a bit of an embellishment, but if you were in this scenario, you couldn’t tell for sure without additional context. You’re working off the simplest possible conclusion.
The whole zebras versus horses idea is a famous adage from the physician and researcher Dr. Theodore Woodward. Woodward came up with the metaphor in the 1940s to encourage his medical students to start with the most common explanation, study ongoing behavior, then use data and science to work towards more complicated possibilities.
In marketing, we use website data to do this all the time. After making hypotheses about performance, we use data to tell the right story. The information reveals potential ailments and shows us the overall health of our website. It helps us determine whether it's a simple fix like a broken call-to-action (horses) or another significant challenge we did not expect, like a drastic decline in blog performance because Google made an update (zebras.)
However, establishing this kind of relationship with data and reporting is challenging. You know you should track and report on how your website is doing, but with so many elements going into that performance, it can be challenging to start. That’s why we use HubSpot reporting to record our website performance and tell that story. We get an all-encompassing view and never have to guess whether or not poor performance could be something detrimental to our growth.
Like you know, a wild zebra.
Measuring Website Performance Metrics
One of the most significant challenges of reporting on website performance is knowing what to measure. There are so many ways to collect data, and so many types of metrics to evaluate. What matters and what doesn't? How can you study your website performance on an ongoing basis without getting lost in the weeds?

(Zebra, weeds. The metaphor is there.)
The answer is HubSpot Reporting. HubSpot provides a Marketing Performance Dashboard that provides a quick and easy look at your funnel. The Marketing Performance Dashboard is top notch and challenging to find on any other platform. Using the dashboard, we measure a few key metrics for all of our clients. Each of these metrics tells us a cohesive story about how we’re doing, and how we need to improve.
Organic Traffic
Organic traffic is the long-term fuel source of leads, and it should always be growing. It tells us how many people are finding and engaging with our content from various sources. A low volume of organic traffic from search could mean there is an ongoing challenge with SEO. A high amount of traffic to a particular page can indicate it's ranking in the SERPs. Regardless of good or bad performance, understanding the why behind organic traffic is critical to developing and fine-tuning strategies.
For more detail about studying this traffic, Moz has a great piece about telling whether or not your declining organic traffic is an optimization or tracking problem. We also have a guide on how to increase organic website traffic with twelve tactics we frequently use.
Landing Page Conversion Rate
Tracking your landing page conversion rate is a big deal. If you have high conversion rates on a page, you can allocate more time and budget to promoting that LP more. If you have low conversions, you can gain insight on whether you need to optimize the LP or stop sending people to it. Ben Cotton of HubSpot identifies the practice of tracking and optimizing pages as a significant area of improvement.
"CRO is a huge, often untapped opportunity for marketing teams, and you might be surprised by the oversized impact you could deliver by fine-tuning your website for conversions."
HubSpot offers a lot of functionality to optimize for conversions, such as lead flows, A/B testing, workflows, and more. From adjusting copy to selecting a better video or image, we employ a few tried and true ways to improve conversion rates.
Blog Report Metrics and Pages Report
In HubSpot, several blog report metrics are incredibly helpful. HubSpot separates blog posts to gauge the performance of each one. You can see where traffic is coming from, as well as the number of views and submissions the article continues to receive.
Here’s an overview of a how HubSpot provides that information in our portal.
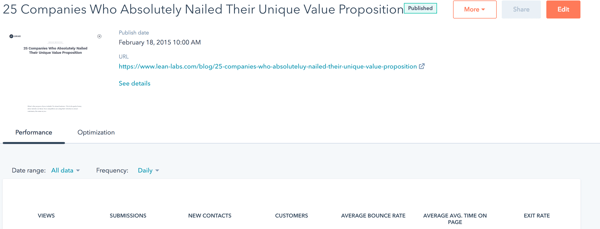
We can see how a Lean Labs blog post from 2015 continues to drive traffic and leads back to our site. We can measure the performance of all of our blog posts, getting as granular as we need to. In HubSpot, navigating this data is easy, but would take a lot of work in another system.
Eric McCarthy, another inbound marketer here at Lean Labs, cites the top-converting blog posts as his favorite view.
“You can see which blog posts are getting the most traffic, go in, and optimize those posts for conversions,” says Eric. “It’s also a great way to prioritize time spent on optimization,” he points out.
CTA Click-thru Rate
Your CTA click-thru rate tells a story about the topics and types of content that your audience finds the most compelling. With this context, you can assess the strongest and weakest calls-to-action all across your site. HubSpot also shows you how well a CTA performs over time. Here's an overview of click history for one of our calls-to-action:
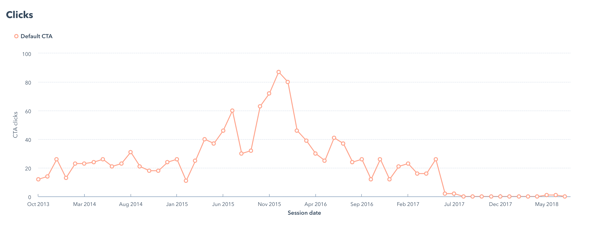
The information can inform changes such as copy, size, and color. HubSpot’s CTA tool has the ability to A/B test CTAs, as well as make smart calls-to-action that switch out depending on a customer’s buyer journey stage. For more guidance, check out this post we wrote about how to convert more leads from your HubSpot CTAs.
Total Traffic
When you track the trends of your overall traffic (not just organic), you can measure the effectiveness of your website and marketing efforts. The information shows you the areas of your site that customer finds valuable, and which pages might need more work. On the marketing side, you can see which sources are providing the most and least volume of leads.
Ryan Scott, head of inbound marketing at Lean Labs, tracks our website total traffic religiously. Because of this, he can document anything that leads to significant increases. Through the process, Ryan is making a lot of revelations about our ongoing efforts.
"March saw a 14% increase over February. To have that kind of growth on an ongoing basis, we’re going to have to implement new things we’ve never focused on," says Ryan.
It's all about tracking the trends and experimenting with new ideas. It can also be essential to locating bugs and issues on your site. A quick dip on a landing page that was previously performing well can indicate there’s a problem significant enough to derail traffic. This way, you can prioritize fixing areas of your marketing that will drive the most ROI back to you.
Conversion Rate by Traffic Source (Channel)
Conversion rate by traffic source informs smarter budget and allocation decisions. You can see which traffic sources are most valuable, and spend more time getting results from those sources. With this data, you can make sense of hiring new team members, shifting budget within your marketing strategy, and prioritize tasks accordingly. Otherwise, you'll operate off assumptions, which won't help you grow or learn anything about your audience.
If you don’t track this metric, you’ll also waste a lot of time and energy on channels that aren’t driving the kind of performance you need to grow. For startups with a limit to their resources, this can make or break your success.
Anticipating Growth With Ongoing Reporting
In a climate with drastic shifts in algorithms, customer preferences, and traffic coming from voice and mobile searches, your data can be your North Star. Regardless of good or bad performance, you can use your website performance to back up critical decisions and operate with the best possible chance of success. Otherwise, you’ll manage blindly, burn through your budget, and quickly dig yourself into a hole.
Similar to how Woodward’s approach to medicine, marketing is all about learning about knowing the symptoms, tracking the right indicators, and coming up with a remedy to fix an ailment. However, it’s difficult to assess what success looks like without a solid grasp of your goals. If you're foggy on what your website goals are, check out our Goal Setting Guide. With this interactive workbook, you can set a three-year outlook in minutes.
About Lean Labs
The only outsourced growth team with a track record of 10X growth for SaaS & Tech co's. 🚀
Explore Topics

Discover the Hidden Strategies We Use to 10X Our Clients Growth in 36 Months!
The Growth Playbook is a FREE guide to planning, budgeting and accelerating your company’s growth.